How do AI-Based fitness trackers work? Ft. 1D CNNs
An article on how the algorithms that come with AI-based fitness trackers for activity recognition work and a brief introduction to 1D-CNNs. Originally written on my blog PixelPie.org

Fitness trackers are extremely à la mode these days. You see many people rocking one and it is indeed quite a novel piece of tech. But have you ever wondered how these devices work, be it a fitness wrist band recording all your sprints and strolls or a mobile phone counting your steps? In this post, I’d like to share how activity recognition in fitness trackers or any automatic psychological signal trackers and analyzers work. I would also like to share my learnings working with similar techniques as a data scientist at Dozee. We will see the flow of building an algorithm from start to end in brief through this post.
Introduction
Fitness trackers come under human-centered computing, which is an emerging field that aims to understand human behavior and integrate user and social context with the computer system. What these devices do is record signals produced by a user and then predict the physical activity. These signals can be some of the many physiological signals found to play a crucial role in determining human activity. In one such study by UCI, for human activity recognition, signals from accelerometers and gyroscopes from smartphones were used. A deep learning model was built to classify whether a person was walking: upstairs or downstairs, sitting, standing, or lying. They were able to deliver results with above 95% accuracy, which is pretty satisfactory.
Now, let us see how, given a set of multichannel physiological signals, one can go about building an algorithm to classify an action into one of many possible classes. By multi-channel, I mean the signals from different sources or channels. In doing so, we are going to see how we can use 1-Dimensional Convolutional-Neural-Networks to perform these tasks. I’ll try to keep it simple with no-code so that by the end of the post, every reader is aware of what’s happening inside next time he/she uses any smart trackers. Let’s dive right in.
Almost all fitness trackers today host a 3-axis accelerometer and a gyroscope. Accelerometer gives the measure of movement in every direction and gyroscope gives the measure of rotation and orientation. These trackers might have a profusion of other sensors such as the altimeter to measure the altitudes, temperature sensor, etc. Some trackers also have an optical sensor that measures heart rate by illuminating capillaries and recording pulse rate. Let’s keep the focus of this post to track the physical activity of a person.
A hypothetical situation
Let’s assume you work at a quotidian analog watch company that does nothing more than building simple analog watches. Suddenly, seeing a huge market for smart fitness trackers, CEO of the company approaches you and asks you to build an algorithm to detect the physical activity of a user, given that the smartwatch will come with a range of sensors including accelerometers, gyroscopes, optical sensors, altimeters, temperature sensors, etc.
Incisive Analysis
A thorough analysis of the pre-existing data will be the very first task for us. This is an essential step as this forms the basis for our overall approach. Here, we have to make some crucial decisions on which of the many sensors we choose to make predictions on physical activity. This would involve an incisive visualization and interpretation of data, finding the interdependencies within the data, finding the factors that might have a negative influence on prediction, and eliminating them. In our particular case, we need to find a relation between the continuous physiological signal input data and the categorical(walking, jogging, running, etc.) output predictions.

There are many well-proven mathematical techniques such as Point Biserial correlation, Logistic Regression, and Kruskal Wallis H test that can help us find the relation between input signals and between input and output**. **This is a good article that gives further insights on how to and when to perform these tests**. **Again just to remind, this is the step where we are visualizing and interpreting the pre-existing data that we have.
Let’s assume that after a lot of research, visualization, and inputs from industry experts we have narrowed it down to 6 signals, 3 from accelerometer each in a direction perpendicular to other, and 3 from Gyroscope, each along the axis perpendicular to other. So now, we have the signals that we’d be operating on later stages. As mentioned earlier, I’d give a lot of importance to this step as every other step below is based on decisions made here. Performing good research for selecting the input features in the first iteration itself can save you a lot of time, money, and energy.
Operating on data with statistics
After selecting prominent features responsible for activity tracking, we move on to some statistics. For the deep learning model to have a good time learning features, it is generally recommended to convert the raw feature signals in a form that is easier to perform operations on. This step is where you need to apply statistics and see what you can do to give the complete representation of data in a very effective manner. Standardization, Normalization techniques are commonly used to perform this. If you know that the data is evenly spread within a particular range with almost equal likelihood at every point, you can just perform a min-max normalization and bring the data value in the desired range(maybe from -1 to 1).
The type of technique that you use is heavily dependent on the data you operate on. There are tons of articles that give you a good insight into when to use a specific technique. In our particular case, many features follow Gaussian distribution hence we can make data effective to operate on by using standardization. These techniques might sometime improve the accuracy by only a few decimals values; nonetheless, one must try not to skip this step.
Introducing 1D CNNs
Now we have the 6 features in their best possible representations. All we need now is a good architecture that can help the model learn these features. One of the techniques that I want to introduce here is 1 Dimensional Convolutional Neural Networks(CNNs). People familiar with deep learning might already have an idea about CNNs in general and how they have proved to be building blocks of current state-of-the-art computer vision techniques. To just give a simple introduction to CNNs, they are good feature extractors and are heavily used in object detection. In image classification tasks, small windows(feature detectors) roll through the image from left-to-right and from top-to-bottom extracting features at each step.
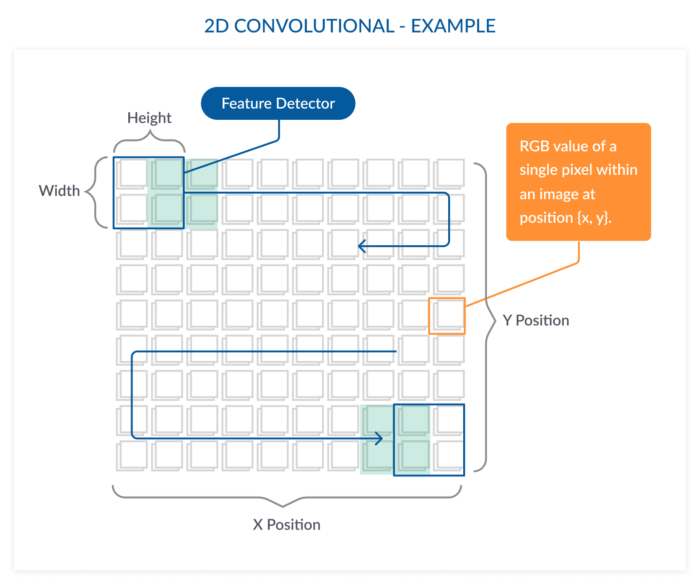
These kernels(small windows) move in both horizontal and vertical directions, hence, ‘2D’ in the name.
What we want to do with our signals is also to extract the features, and we now know CNNs extract them well, so why not use CNN operations? Now the question is how we use a technique that is originally made for images on raw data. Images are nothing but a 3D array in which each cell holds a pixel value. In single-channel images, we just have a 2D array where each cell holds value(For more information on single-channel gray-scale images, check out my post on grayscale televisions). The idea here is to make a 2D array which will hold our feature values instead of pixel values. What if we stack the features vertically with each row representing a feature for 30 seconds duration. Assuming each value is being recorded every second with 30 seconds we get 30 values for each of the 6 features. Hence a 2D Matrix of size 6×30 can be constructed, similar to the figure given below. The six boxes along the vertical axis represent 6 features. The boxes along the horizontal axis give the values of a feature at consecutive time-stamps(1-second in our case).
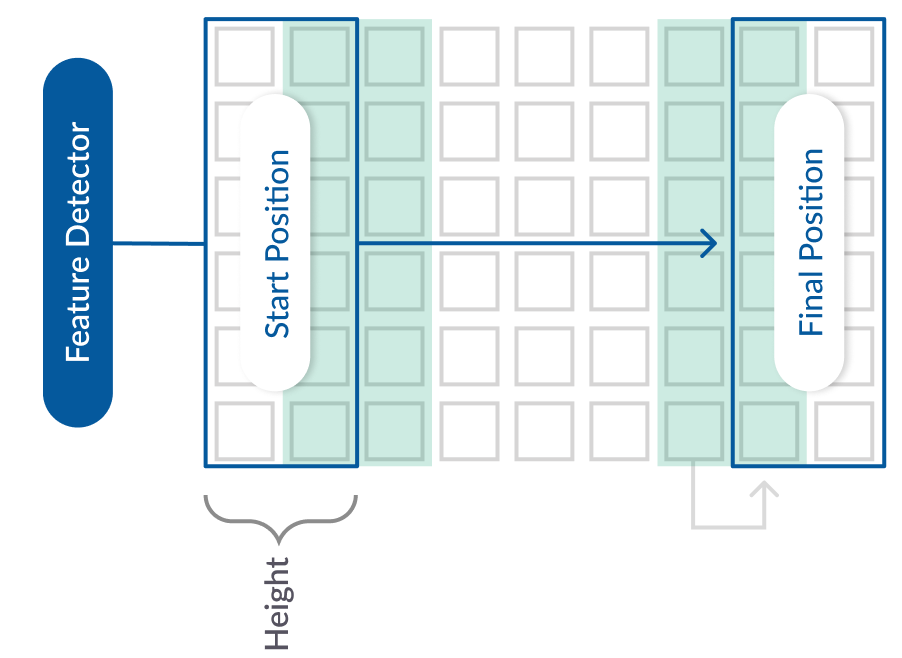
Unlike 2D CNNs, it won’t make sense to take a small feature detector and move it from left to right and top to bottom since we want “all features” to be considered at every time-step. In other words, there is no need for a small feature detector to move from top-to-bottom. We need a feature detector whose vertical-width is equal to the number of features. We can assign this detector a horizontal-height and move it from left to right extracting features at every step and this is what is called 1D Convolutional Operations where the movement of feature detectors is only along one axis. In many other instances as well, where we deal with time-series data(data whose x-axis is time), 1D CNNs stand a good chance to bring out features.
Building the Architecture

Now we have the features and the technique that we’ll be using to build the architecture. From my experience working with other data scientists, it’s good to first get the complete pipeline ready and not waste time trying to build the perfect architecture that might fail to fit in that architecture. It’s better to build a scaffold model, a very naive and simple model, just to make sure that the complete pipeline from the very start to the final architecture stage has no issues. This model can be as simple as having two 1D-CNN layers followed by a couple of fully connected layers.
Once we have the overall pipeline working and we have some benchmark scores from our scaffold run, we are good to go and start building better architectures. We will not be discussing the code here as there are already pretty good articles that do that. This article by Jason will give you a thorough drive through the code involved. Good thing is that our example matches the kind of data that Jason writes code for, so you can dive right into writing the architecture for our example with the help of his article. I recommend reading it as it might also cover a few points that I couldn’t cover here.
Tuning & Training
Once we have the skeleton of architecture ready, we can start training the model. There are many machine learning parameters such as learning rate, batch size, epochs, etc. that can be set by us and some can have a profound effect on the training process. There are tons of well-written articles about these parameters and how one goes about playing with them. ‘Hyperparameter tuning methods’ section in this article by Jeremy gives a good insight and holds the potential to reduce efforts on your expedition to find the perfect hyper-parameters. If you are using TensorFlow, I’d recommend taking advantage of tensorboard which gives you a brief summary of the training process.
Assuming all steps were followed well, you should be getting pretty good scores for this particular task of activity recognition. Apart from sequential architectures in which each layer follows the other, you can even try building multi-headed architectures that might boost up the accuracies. I’ll be writing a separate post on multi-headed CNNs soon.
Few Tips
Some times you may find that your model is performing really bad even after trying with a gamut of hyper-parameters. The first thing I’d recommend to do in such cases is checking the training data. Make sure it is exactly what you expect it to be, focus on how you are handling the missing data points, and make sure you don’t send NA/NaN data points to the model. Make sure you are using proper activation functions, optimizers, and loss functions for training the model. Keep a check if the model is overfitting or underfitting by providing it with an unseen test dataset and evaluating it.
Happy Ending
After multiple iterations on this training pipeline, you finally succeed in building a model with a high-grade score that is ready to be deployed and moved on to the server. Now what you have is a deep learning model that takes raw physiological signals as inputs and returns the activity that a person is performing. You present it to the production team and now the brand new smart tracker comes with your algorithms in it. Everyone in the team is happy.
I hope you enjoyed reading this post on how fitness trackers and algorithms running beneath work. Let me know in the comments or through e-mail (nemath@pixelpie.org) if you have any suggestions. Also, do visit PixelPie.org for more such articles on AI and Tech. Pixel Pie has been something I wanted to do for a long time, and now that I have finally started it, I’d really appreciate your help and support. I also plan on starting a weekly tech podcast complementing the posts, bringing fresh ideas and innovations from across the globe. Let me know what you think about it.